


Related

The Vessel Command, Control and Management System (VC2MS) is intended to facilitate intuitive access to relevant system information for rapid diagnosis and control input.

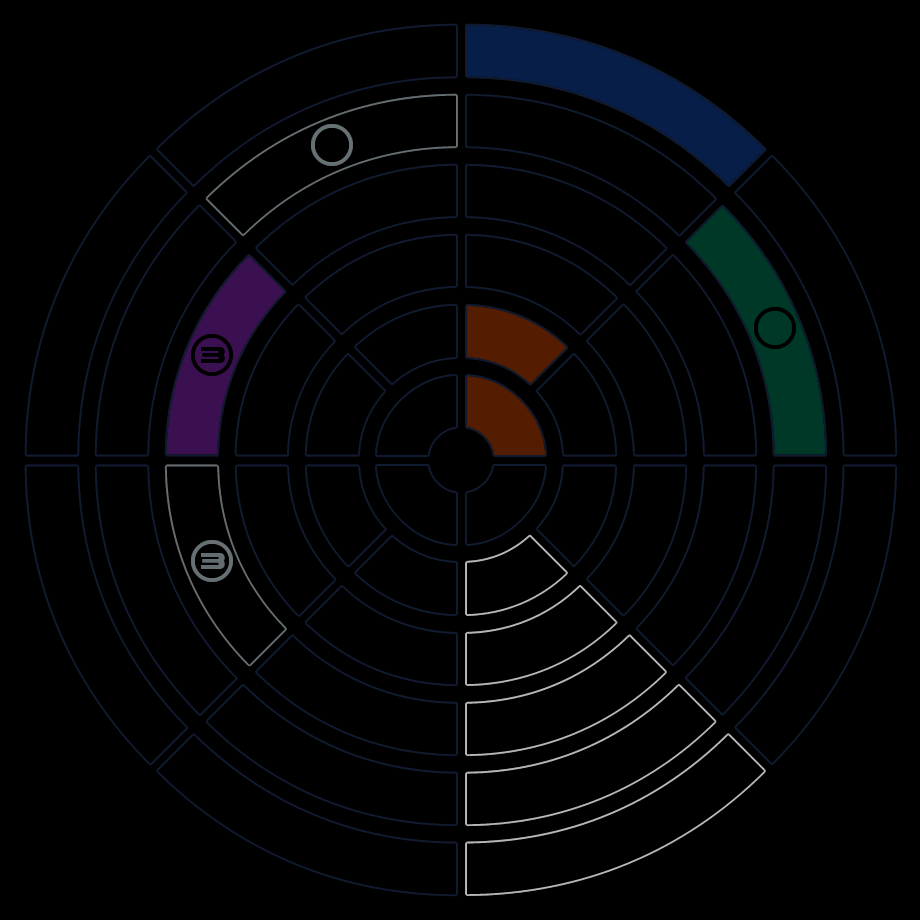
The Proximity Grid is a multi-purpose module designed to quickly visualise range and direction. The significance of the visualisation will depend on the context of the module’s integration.
The grid can be used purely as a visualistion or it can accept inputs, or both.
The module is typically used to visualise scans, with the scanning vessel at the centre of the grid.
An example is the Peak Frequency Analysis panel SC-FRQ01.
Layout
The grid is made up of five concentric rings, each divided into eight radial segments of 45 degrees.
An additional central ring is divided into four segments. This central ring often takes on additional significance depending on context, for example indicating direct contact or a direct hit (as shown by the ochre segments in the example).
A segment of the grid can be tapped to select that point of interest (if input is enabled), or changes to a solid colour to represent a point of interest (which could then be tapped to display additional data, if enabled).
The core of the grid represents the origin or focus of measurement.
Range
The layers of concentric rings indicate range, starting from the core representing closest range to the outer ring representing furthest range.
Direction
The radial segments indicate approximate direction.
Function
The grid’s display and selection functions (if enabled) have standardised behaviour.
Selection
If a proximity grid allows segments to be selected, this will be indicted by a circle icon which appears in the middle of the segment in any status other than inactive (see below).
A segment must be tapped in its centre (indicated by the circle icon) to select it.
Status
Segments can indicate different status.
Inactive
A segment’s default state is a grey outline with a black interior. This indicates the segment is not active.

Pending
Pending status is indicated by the outline of the segment becoming bolder, with the interior of the segment displayed as black except for a grey circle icon in the center.
This acknowledges the segment has been selected pending another action (such as assigning the segment to a monitor so that data or configuration options can be displayed. Once that action has been completed the segment’s status indication will change.
A segment with pending status can be tapped again (before any other action is taken) to cancel the selection.
Active

Active status is indicated by the segment changing to a solid colour from the Standard Designation Display Protocol (SDDP). If selection has been enabled, a black circle icon appears in the middle of the segment (indicating where to tap).
This status is typically initiated by the data monitor associated with the proximity grid and indicates a point of interest.
If tapped, the segment with change to pending status.
Assigned
Assigned status indicates that the segment has been associated with a data monitor or input panel on the console panel which will display data or configuration options associated with the segment.

Assigned status adds a number in the centre of the segment which corresponds to the number of the monitor/input panel, but doesn’t otherwise change the current appearance of the segment.
Depending on configuration, tapping an assigned segment may unassign it from the monitor/input panel.
Sweep
A continuous radial sweep can be configured to indicate when the system associated with the grid is operating. The sweep is indicated by an entire radial segment with a lighter outline than the main grid.
The user can usually override the sweep’s settings by making it faster or slower, or disabling it. These settings are accessed by tapping the core of the grid.
Filter
The grid may be configured with user-configurable filters.
Integration
The proximity grid can typically integrated with other display elements such as a selectable list display. This provides somewhere to display point-of-interest data once a segment on the grid has been tapped.