


Linear Monitor Module
 The Linear Monitor module provides a simple level-based visualisation for groups of related navigational datapoints such as EM emissions.
The module allows display of a calibration value (such as nominal or trip-point value) and uses colour to indicate when this value or the maximum value is exceeded.
Actual numerical values can be displayed to a specified number of decimal places or as a percentage of maximum.
Module Modes
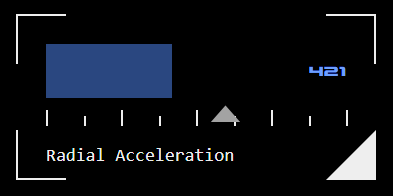
The module has two display modes, which allow datapoint level bars to be displayed vertically or horizontally.
The module also has two data modes. It can be configured to take data from the navigation database, or from a specified intergrid.
 These sources cannot be mixed within the module, although when in intergrid mode different intergrid sources can be specified for each datapoint.
Module Display Options
Up to eight datapoints can be monitored. These will be sized to fit the available space.
Group Frame Display
A group frame with a group label can be enabled.
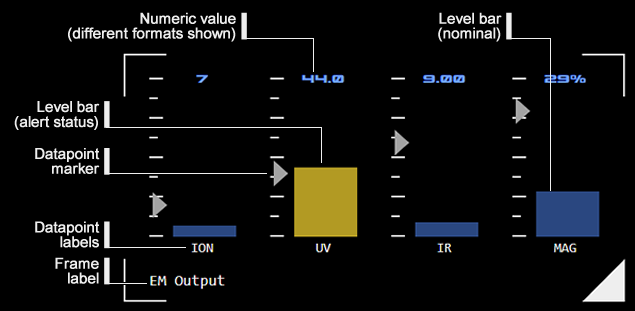
Numeric Display
A numeric value can be displayed for each datapoint. When enabled, this option displays values for all datapoints - numeric display cannot be toggled for individual datapoints, although display format is individually configurable (see below).
Datapoint Label Display
Labels for each datapoint can be enabled (whether a group frame is displayed or not). When enabled, this option displays values for all datapoints – they cannot be toggled individually.
Datapoint Display Options
Each datapoint has individually-configurable display options:
Numeric Value Display
If enabled, there are options for numeric value display format. The maximum and minimum values for each datapoint must be specified. Minimum is usually zero.
If the datapoint value exceeds the maximum value, the level bar will change to alarm status.
Actual Value
The actual value can be displayed, rounded to a configurable number of decimal points.
Percentage
A value as a percentage of the maximum-minimum range will be displayed.
Marker Display
A marker representing a calibration or target value can be specified. This will be displayed on the graticule as a triangular icon.
If the datapoint value exceeds the marker value, the level bar will change to alert status.
Setting the marker value to zero will disable marker display for that datapoint.
Concept Site
Immersive sci-fi and how to join the adventure
Crew Site
Information and tools for ISDC crew members


